Pollsters vs Polymarket
The great battle between statistics against the wisdom of the crowd. Who wins?
Recently, I came across a paper Are Betting Markets Better than Polling in Predicting Political Elections? written by Cutting, Hughes-Berheim, Johnson, Baroud, and Brett Goldstein. The authors analyzed the accuracy of polls conducted during the 2024 Trump vs Harris US election and compare it to the probability of winning for each of the candidates implied by Polymarket.
The case of the US elections suggested that people might have been ‘onto something’ and perhaps were (consciously or not) aware of some subtleties undetectable via traditional polling methods. On the other hand, though, they might’ve simply been lucky. I genuinely couldn’t tell, so I decided to put this hypothesis to a little test.
What are the criteria?
For the sake of simplicity, I decided to restrict my attention to 1 vs 1 presidential elections that took place since 2024 and were decided by nationwide voting. We’ve got only 20 samples due to not-so-secret reasons:
-
There are fewer than 100 countries that are widely considered democratic.
-
Some democratic countries are monarchies.
-
In many democratic countries, the president is chosen by a parliament or another institution.
-
In some cases, a presidential election might get resolved without a 1 vs 1.
-
Sometimes there isn’t a Polymarket market for some event (especially true for anything before mid 2024).
Another obstacle is that in some cases one candidate had such an enormous advantage that a victory was almost trivial to foresee. If we define a 1 vs 1 election to be “interesting” if no candidate has an implied probability of winning exceeding 90% (Polymarket, the election day midnight), then we are left with… 8 examples.
I’m not gonna lie, the resulting sample size turned out to be more disappointing than I expected. While we can’t perform any reasonable statistical analysis here, I was still interested in which side would come on top.
Results
Below, Adjusted Polling Margin represents the average advantage of the winning candidate in the runoff election polls, with the two most extreme measurements discarded. Of course, there are no runoff elections in the US, so I had to make a compromise and consider the final polling averages instead.
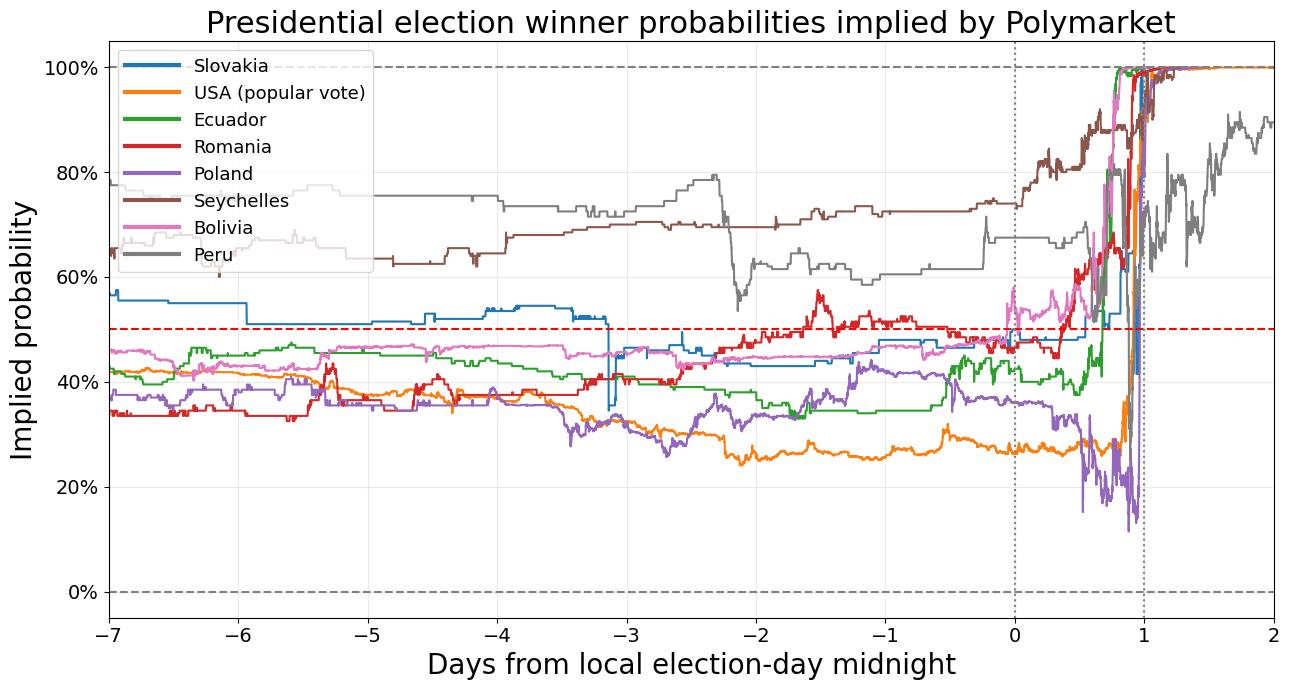
As for Polymarket, I considered the implied probability at midnight just before election day.
It’s worth noting that we compare apples to oranges to an extent. For example, Polymarket might have an unfair advantage because, at midnight, it already “consumed” all the information coming from polls.
Another issue is actually even more fundamental: the percentages measure two very different things. If, for instance, we know with certainty that Candidate A in some country X is supposed to get 51%, then his Polymarket probability should collapse to 100% while the polls themselves might still point at around 51%. Theoretically, if the sample was of any decent size, we could perhaps use the logistic regression to see if there is any concrete relationship between these two numbers.
The colours in this table were chosen rather arbitrarily. In the APM column, we award the yellow label to those within 1 pp. of 50%. As for the Polymarket columns, I wasn’t exactly certain whether Romania’s 46.5% should be yellow or red, but eventually I went with red.
| Country | Polymarket Implied Probability | Adjusted Polling Margin | Winner |
|---|---|---|---|
| Slovakia | 50.0% | −1.05 pp | Polymarket |
| USA (popular vote)* | 26.3% | −0.67 pp | Pollsters |
| Equador | 42.5% | −1.27 pp | Neither |
| Romania | 46.5% | −1.38 pp | Neither |
| Poland | 36.2% | −0.55 pp | Pollsters |
| Seychelles | 74.0% | ** | Polymarket by W.O. |
| Bolivia | 53.6% | −7.95 pp | Polymarket |
| Colombia | 83.5% | 7.75 pp | Tie |
|
* Not exactly a proper 1v1.
** There was no reputable runoff poll for Seychelles. |
|||
I’ll leave the final verdict to the reader. If I were forced to claim anything more concrete, I’d point out that apparently if the chances look roughly 50/50, they might indeed be 50/50, and no one truly knows what will happen. Of course, the sample size is bordeline non-existent, so any confidence here would be premature.
I am, however, genuinely impressed by how well Polymarket fared in Bolivia’s case. I am far from an expert on Bolivian politics, so I can’t tell whether the source of the discrepancy is some unusual restriction imposed upon pollsters or a massive, rapid shift in sentiment.
Another interesting case is Peru, where the wave function of Polymarket failed to collapse even a full day after election day when an “80% to ~25% to 70%” rollercoaster occurred.
Honorable mention goes to Poland for the most dramatic upswing.