Geometry of Variance Estimators

The unbiased variance estimator is given by the well-known formula:
\[\widehat{\sigma}^2 := \frac{1}{n-1} \sum_{i=1}^n \left( X_i - \overline{X} \right)^2 ,\]where $X_1,\dots,X_n$ are independent draws from the same distribution and $\overline{X}$ denotes the sample mean.
From time to time, someone in the room eventually asks:
Why do we have $n-1$ in the denominator? The expression looks almost like an average of $n$ squared deviations, so why isn’t the denominator simply $n$?
There are two answers one usually hears:
- Write down the bias $\mathbf{E}[\widehat{\sigma}^2] - \sigma^2$, expand the square, expand $\overline{X}$, expand all the sums, calculate. See? It’s $0$.
- Because there are only $n-1$ degrees of freedom among the $X_i$, since translating all measurements by the same amount leaves the variance unchanged.
The first answer is formally correct, but it explains little. The second one may feel hand-wavy. Why should degrees of freedom matter at all? Where, exactly, did the missing dimension go?
Since the difference between $\frac{1}{n}$ and $\frac{1}{n-1}$ is most visible for small values of $n$, let us begin by examining what happens in that regime.
Some Intuition: Case $n = 1$
Suppose we have only a single random measurement, and we observe $X_1 = 10$.
There are many pairs $(\mu,\sigma)$ consistent with such an observation, for example:
- $\mu \approx 10$ and $\sigma$ very small,
- $\mu \approx 10$ and $\sigma \approx 50$.
There is no way to decide which scenario is closer to the truth. A single observation offers no reliable information about the variance.
Let’s add another piece of information: we’re additionally told that $\mu = 15$. Now we can at least try to guess that, for example, $\sigma \ll 1$. Weak information, but no longer nothing.
With the exact value of the mean pinned down, we are granted a point of reference. It turns out that for fixed $\mu$ we can construct a slightly different unbiased estimator:
\[\widehat{\sigma}^2_{\mu\text{ known}} := \frac{1}{n} \sum_{i=1}^n \left( X_i - \mu \right)^2\]Replacing $n$ with $n - 1$ in the denominator might be viewed as a premium paid for not knowing the exact value of $\mu$. In the following sections, we try to make this intuition more precise.
Orthogonal Projections
When thinking about $\widehat{\sigma}^2$ geometrically, we may view it as the squared Euclidean norm of an $n$-dimensional vector, normalized by $n-1$. If we define the sample vector
\[\boldsymbol{X} = [X_1, \dots, X_n]^\top\]and the center-of-mass vector
\[\boldsymbol{C} = \overline{X}\,\mathbf{1} = [\overline{X}, \dots, \overline{X}]^\top,\]where $\mathbf{1}$ stands for the all-ones vector, then
\[\widehat{\sigma}^2 = \frac{1}{n-1}\,\lVert \boldsymbol{X} - \boldsymbol{C} \rVert_{\ell^2}^2.\]Here $\lVert \cdot \rVert_{\ell^2}$ denotes the Euclidean norm, the standard way mathematicians refer to ‘distance from zero’.
Neat. We are interested in the expected distance from $\boldsymbol{X} - \boldsymbol{C}$ to $\mathbf{0}$. Let’s notice a simple but important property of this vector: if we define $X_i’ = X_i - \overline{X}$ for $i = 1, \dots, n$, then
\[\langle \boldsymbol{X} - \boldsymbol{C}, \mathbf{1} \rangle = X_1' + \dots + X_n'=\] \[\left( X_1 - \frac{X_1 + \dots + X_n}{n} \right) + \dots + \left( X_n - \frac{X_1 + \dots + X_n}{n} \right) = 0.\]This shows that the random vectors $\boldsymbol{X}-\boldsymbol{C}$ are perpendicular to the all-ones vector $\mathbf{1}$. Since $\boldsymbol{C}$ itself is a scalar multiple of $\mathbf{1}$, it follows that $\boldsymbol{X}-\boldsymbol{C}$ is the orthogonal projection of $\boldsymbol{X}$ onto the hyperplane
\[x_1 + \dots + x_n = 0.\]Let’s take a look at a simple case in dimension two.
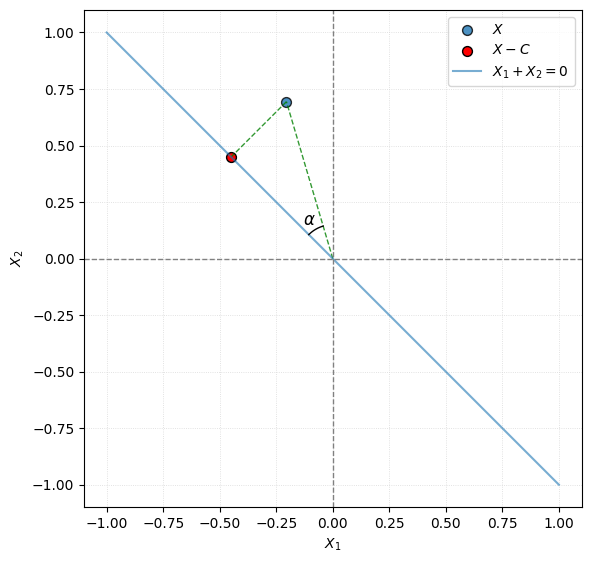
Even though the scenario depicted above may appear simplistic, it still allows for a few useful observations.
- If $\mu = 0$, the squared distance of the blue point from the origin represents $n\,\widehat{\sigma}^2_{\mu\text{ known}}$. Changing $\mu$ simply translates the point along the $[1,1]^\top$ direction, while its projection remains fixed.
- Similarly, the squared distance of the red point from the origin represents $(n-1)\,\widehat{\sigma}^2$, where we pretend that the true value of $\mu$ remains unknown.
Basic trigonometry shows that we have
\[\lVert \boldsymbol{X} \rVert_{\ell^2} \cos(\alpha) = \lVert \boldsymbol{X} - \boldsymbol{C} \rVert_{\ell^2},\]which in the $\mu = 0$ case implies
\[n\,\widehat{\sigma}^2_{\mu\text{ known}} \cos(\alpha) = (n-1)\,\widehat{\sigma}^2 .\]Now observe that replacing $n-1$ with $n$ in the definition of $\widehat{\sigma}^2$ would lead to a highly dubious identity
\[\widehat{\sigma}^2_{\mu\text{ known}} \cos(\alpha) \stackrel{?!}{=} \widehat{\sigma}^2.\]Since $\lvert \cos(\alpha) \rvert \leq 1$, this would systematically push the variance estimate downward. This is precisely the bias we want to avoid.
While this is not yet a proof, it is already clear that using $\frac{1}{n}$ is a wrong choice of the normalization factor when constructing $\widehat{\sigma}^2$.
More Intuition: Case $n = 2$
In this experiment we sample $\mu$ from the interval $[-3, 3]$. For this mean we draw $(X_1, X_2)$ pairs $500$ times, where $X_1$ and $X_2$ come from the normal distribution $\mathcal{N}(\mu, 1)$. For each pair, we estimate the variance by computing both $\widehat{\sigma}^2$ and $\widehat{\sigma}^2_{\mu \text{ known}}$.
We proceed in the same way as in the previous subsection:
- To obtain $\widehat{\sigma}^2_{\mu \text{ known}}$, we compute the distance from $(X_1, X_2)$ to $(\mu, \mu)$.
- To obtain $\widehat{\sigma}^2$, we compute the distance from the origin to the projection of $(X_1, X_2)$ onto the line $X_1 + X_2 = 0$.
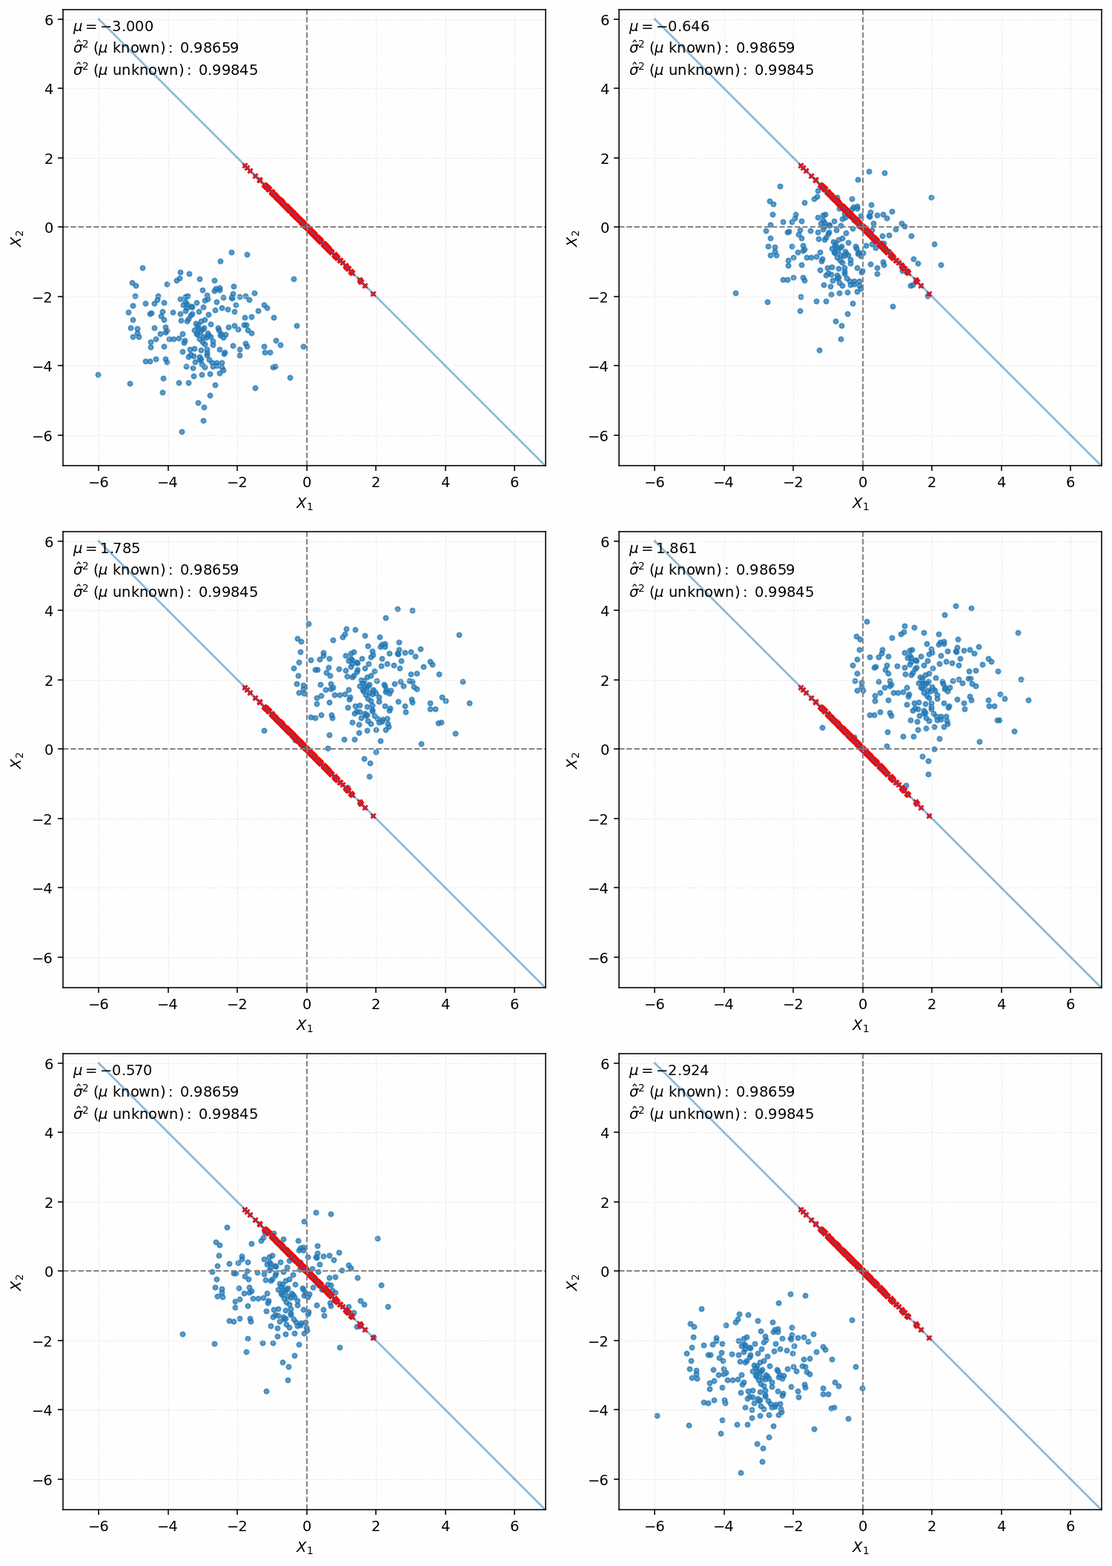
As the animation shows, both estimators remain constant as $\mu$ varies. This is expected: $\widehat{\sigma}^2_{\mu \text{ known}}$ is proportional to the distance from the center of the blue mass, so translating it changes nothing. On the other hand, $\widehat{\sigma}^2$ is based on projections that remain fixed when we move the blue mass along the $[1,1]^\top$ vector.
We observe that the deviation of the red dots is systematically smaller, since one direction is removed entirely. To see what’s the main source of this discrepancy, let’s consider a blue point $\boldsymbol{X} = (4.01, 4.03)$ under $\mu = 2$. Being far from the center of the blue mass, it contributes a lot to the average deviation. However, after projection the same point is mapped to $\boldsymbol{P}(\boldsymbol{X}) = (-0.01, 0.01)$, which lies very close to the center of the red mass.
This reflects the fact that observing $X_1 = 4.01$ and $X_2 = 4.03$ with $\mu$ unknown naturally suggests values concentrated around $4$ and a small variance. While $n = 2$ hardly constitutes a meaningful sample, this interpretation is at least reasonable if one is forced to make a judgement.
To observe a similar effect for larger samples (namely, all measurements clustering together while remaining far from the true mean) we would need to be rather unlucky. This explains why replacing $\frac{1}{n}$ with $\frac{1}{n-1}$ becomes almost irrelevant for large $n$, but critical when the sample is small.
Geometric Argument, Made Formal
Let’s play around a bit with the expression
\[\widehat{\theta} := \sum_{i=1}^n \left( X_i - \overline{X} \right)^2 ,\]As we’ve already seen, the sum looks like an $\ell^2$ norm of something. To make this precise, let’s re-introduce the following notation:
\[\text{the sample vector}\quad \boldsymbol{X} = \begin{bmatrix} X_{1} \\ \vdots \\ X_{n} \end{bmatrix}, \qquad \text{the all-ones vector}\quad \boldsymbol{1} = \begin{bmatrix} 1 \\ \vdots \\ 1 \end{bmatrix}.\]We can form the vector $\boldsymbol{X} - \boldsymbol{1}\overline{X}$, noting that $\overline{X}$ is just a scalar:
\[\boldsymbol{X} - \boldsymbol{1} \overline{X} = \begin{bmatrix} X_{1} - \overline{X} \\ \vdots \\ X_{n} - \overline{X} \end{bmatrix}.\]We see that $\widehat{\theta}$ is obtained by summing the squares of the entries of the vector above. That gives us
\[\widehat{\theta} = \| \boldsymbol{X} - \boldsymbol{1} \overline{X} \|_{\ell^2}^2.\]This observation also allows us to rewrite $\widehat{\theta}$ in a more compact way, more suitable for matrix calculations:
\[\widehat{\theta} = \langle \boldsymbol{X} - \boldsymbol{1} \overline{X}, \boldsymbol{X} - \boldsymbol{1} \overline{X} \rangle = \left( \boldsymbol{X} - \boldsymbol{1} \overline{X} \right)^\top \left( \boldsymbol{X} - \boldsymbol{1} \overline{X} \right).\]The expression $\boldsymbol{X} - \boldsymbol{1} \overline{X}$ looks meaningful in some way. It would be neat to have a linear operator $\boldsymbol{P}$ that satisfies
\[\boldsymbol{P} \boldsymbol{X} = \boldsymbol{X} - \boldsymbol{1} \overline{X},\]so we could study its properties and hopefully get some insights. To get there, we need to describe $\overline{X}$ in terms of $\boldsymbol{X}$:
\[\overline{X} = \frac{1}{n} \left( X_1 + \dots + X_n \right) = \frac{1}{n} \boldsymbol{1}^\top \boldsymbol{X}.\]Of course, the dot product above could also be described as $\boldsymbol{X}^\top \boldsymbol{1}$, but we need $\boldsymbol{X}$ itself not to be transposed. Then,
\[\boldsymbol{X} - \overline{X} \boldsymbol{1} = \boldsymbol{X} - \frac{1}{n} \boldsymbol{1} \boldsymbol{1}^\top \boldsymbol{X} = \underbrace{ \left( \mathbf{id} - \frac{1}{n} \boldsymbol{1}\boldsymbol{1}^\top \right) }_{\boldsymbol{P}} \boldsymbol{X}.\]Just for the record, the matrix $\boldsymbol{P}$ is:
\[\boldsymbol{P} = \begin{bmatrix} 1 & 0 & \cdots & 0 \\ 0 & 1 & \cdots & 0 \\ \vdots & \vdots & \ddots & \vdots \\ 0 & 0 & \cdots & 1 \end{bmatrix} - \frac{1}{n} \begin{bmatrix} 1 & 1 & \cdots & 1 \\ 1 & 1 & \cdots & 1 \\ \vdots & \vdots & \ddots & \vdots \\ 1 & 1 & \cdots & 1 \end{bmatrix} = \begin{bmatrix} 1-\frac{1}{n} & -\frac{1}{n} & \cdots & -\frac{1}{n} \\ -\frac{1}{n} & 1-\frac{1}{n} & \cdots & -\frac{1}{n} \\ \vdots & \vdots & \ddots & \vdots \\ -\frac{1}{n} & -\frac{1}{n} & \cdots & 1-\frac{1}{n} \end{bmatrix}.\]Fine, we succeeded in creating an operator $\boldsymbol{P}$ of the desired property. We get
\[\widehat{\theta} = (\boldsymbol{P} \boldsymbol{X})^\top (\boldsymbol{P} \boldsymbol{X}) = \boldsymbol{X}^\top \boldsymbol{P}^\top \boldsymbol{P} \boldsymbol{X}.\]The matrix/operator $\boldsymbol{P}$ has two critical properties:
- It is symmetric, so $\boldsymbol{P}^\top = \boldsymbol{P}$.
- It effectively subtracts the mean (or the center of mass) from a vector. Doing it twice changes nothing because the mean has already been removed after the first pass. Hence, $\boldsymbol{P}^2 = \boldsymbol{P}$.
In other words, it’s an orthogonal projection (as already observed in the previous sections). Thus, we get
\[\widehat{\theta} = \boldsymbol{X}^\top \boldsymbol{P} \boldsymbol{X}.\]To answer what factor fits an unbiased estimator of variance, we need to calculate the expected value of the expressions above. To this end, we need a supplementary result.
Little Lemma. $~$ Let $\boldsymbol{X}$ be a random vector of independent entries of length $n$ such that $X_i \sim X$ for all the indices $i$, where $X$ is a random variable with well defined expected value $\mu$ and variance $\sigma^2$. Let $\boldsymbol{A}$ be an $n \times n$ matrix. Then,
\[\mathbf{E}\!\left[ \boldsymbol{X}^\top \boldsymbol{A} \boldsymbol{X} \right] = \mu^2 \Sigma_{\boldsymbol{A}} + \sigma^2 \operatorname{tr}(\boldsymbol{A}),\]where $\Sigma_{\boldsymbol{A}}$ stands for the sum of all the entries of $\boldsymbol{A}$ and $\operatorname{tr}(\boldsymbol{A})$ for the trace of $\boldsymbol{A}$.
Proof. $~$ Unfortunately, we need to simply expand. It doesn’t seem like there is anything more clever we could pull off:
\[\mathbf{E}\!\left[ \boldsymbol{X}^\top \boldsymbol{A} \boldsymbol{X} \right] = \sum_{i=1}^n \sum_{j=1}^n A_{ij} \mathbf{E} \left[ X_i X_j \right].\]Provided that $i \neq j$, we have
\[\mathbf{E} \left[ X_i X_j \right] = \mathbf{E} \left[ X_i \right] \mathbf{E} \left[ X_j \right] = \mathbf{E} \left[ X \right]^2 = \mu^2.\]On the other hand, if $i=j$, then $\mathbf{E} \left[ X_i X_j \right] = \mathbf{E} \left[ X^2 \right]$ and we notice
\[\sigma^2 = \mathbf{E} \left[ (X - \mu)^2 \right] = \mathbf{E} \left[ X^2 \right] - \mu^2,\]which gives $\mathbf{E} \left[ X^2 \right] = \sigma^2 + \mu^2$.
This gives us
\[\mathbf{E}\!\left[ \boldsymbol{X}^\top \boldsymbol{A} \boldsymbol{X} \right] = \mu^2 \sum_{i=1}^n \sum_{j=1}^n A_{ij} + \sigma^2 \sum_{i=1}^n A_{ii} = \mu^2 \Sigma_{\boldsymbol{A}} + \sigma^2 \operatorname{tr}(\boldsymbol{A}).\]□
In our discussion, we are interested in calculating $\mathbf{E} \left[ \boldsymbol{X}^\top \boldsymbol{P} \boldsymbol{X} \right]$. This turns out to be quite simple, because the sum of all the entries vanishes. We thus have
\[\mathbf{E} [ \widehat{\theta} ] = \sigma^2 \operatorname{tr}(\boldsymbol{P}) = (n-1)\sigma^2.\]That’s all. To make the estimator unbiased, we just divide $\widehat{\theta}$ by $n-1$.
Appendix: What if $\mu$ is known?
Let us follow the same geometric argument as above. First, we note that
\[\mathbf{E}[\widehat{\sigma}^2_{\text{$\mu$ known}}] = \mathbf{E}[\boldsymbol{X}^2] - \mu^2.\]We also observe that for the sample vector $\boldsymbol{X}$ it holds that
\[\mathbf{E}[\boldsymbol{X}^2] = \frac{1}{n} \| \boldsymbol{X} \|_{\ell^2} = \frac{1}{n} \boldsymbol{X}^\top \boldsymbol{X}.\]In other words, we now deal with $\boldsymbol{X}^\top \boldsymbol{X}$ instead of $\boldsymbol{X}^\top \boldsymbol{P} \boldsymbol{X}$. The projection matrix $\boldsymbol{P}$ got replaced by the identity matrix $\mathbf{id}$. Applying Little Lemma, we obtain
\[\frac{1}{n} \mathbf{E}\!\left[ \boldsymbol{X}^\top \boldsymbol{X} \right] = \mu^2 + \sigma^2,\]since $\text{tr}(\mathbf{id}) = n$. This yields
\[\mathbf{E}[\widehat{\sigma}^2_{\text{$\mu$ known}}] = \mu^2 + \sigma^2 - \mu^2 = \sigma^2.\]The means cancel out, as they should, since the variance has nothing to do with $\mu$. The estimator $\widehat{\sigma}^2_{\mu\ \text{known}}$ is unbiased, and the factor $n-1$ simply does not show up here.